Description of the video:
Climate Resiliency Transcript:
Climate Resiliency: Preparing our Region for Climate Change
I am Caroline Loughren with the Office of Sustainability at Indiana University Northwest.
Today I will be discussing climate resiliency and ways we can prepare for climate change in the region.
What do you think of when you hear climate resiliency?
Climate resilient communities can incorporate a lot of different sustainable practices to better prepare their residents for the impacts of climate change. For example, municipalities can define the climate hazards their communities are up against to come up with suitable solutions.
Would it be best to advocate for policy changes and climate legislation?
Is there a way to mitigate the consequences of climate change in our community? Or would it be best to strive for community adaptation?
What would that look like, and how does it differ from mitigation? As you can see, climate resilience incorporates many different sustainable ideas and solutions. It is important that we understand these solutions, the differences between them, and how we can most effectively include them in community planning.
We can keep these ideas in mind when we learn, (next slide)
Section 1: What Causes Climate Change? (next slide)
Greenhouse Gasses & Our Atmosphere
Greenhouse Gas Emissions are the leading cause of human-induced climate change.
These gasses essentially “trap” radiation in the atmosphere, warming the planet and altering the climate globally.
When sunlight hits the Earth, some is reflected back into space, while some energy interacts with earth’s surface and is re-emitted as infrared energy. Greenhouse gasses in the atmosphere absorb infrared energy that is re-radiated by the Earth, keeping it from escaping into space and causing greenhouse gasses to generate heat.
The main greenhouse gasses emitted from human activity are carbon dioxide, methane, and nitrous oxides. Water vapor is another important greenhouse gas created both naturally and by human activities.
Greenhouse Gas Emissions
Pictured on the right, we can see that carbon dioxide is the most abundant greenhouse gas emitted by human activities, but it is not the only one we should focus on. Methane is actually a more potent greenhouse gas and has the highest climate change potential even though it is present in lower amounts.
Greenhouse gasses are emitted from human activities such as burning fossil fuels, transportation, industrial processes, agriculture, and poor waste management.
GHG Emissions in the U.S. Graph
Here we can see the three biggest producers of greenhouse gas emissions by economic sector. Transportation, electricity consumption, industry, agriculture, commercial and residential.
By understanding the sources of greenhouse gas emissions and their impacts on the climate system, we can implement mitigation measures to reduce overall emissions to slow or reduce the impacts of future effects of climate change. Later, we will discuss what we are doing locally to mitigate emissions.
Transportation
“According to the EPA, in 2017, transportation emissions account for 27% of total U.S. greenhouse gas emissions on a national scale. On a local scale, data conducted in partnership with Indiana University revealed Northwest Indiana transportation generated almost 5 million metric tons of greenhouse gas emissions in 2017 alone. Influenced by intersections by multiple interstate highways, Chicagoland and Northwest Indiana experiences heavy transportation leading to elevated air pollution and emissions.
Energy and Fossil Fuels
According to the EPA, electricity production contributes to approximately 25% of U.S greenhouse gas emissions because our 60% of the energy sector is mostly generated from fossil fuel combustion, particularly natural gas and coal use. Natural gas primarily releases methane while coal combustion primarily releases carbon dioxide.
When this presentation was created in 2022, Indiana had 16 coal-fired power generating stations. Shown on the right hand side is the Michigan City Generating Station, a coal and natural gas fired power plant located on the shore of Lake Michigan, owned and operated by the Northern Indiana Public Service Company or NIPSCO.
NIPSCO, and the parent company NiSource, has shown to be an advocate for making steps to improve our environment. NIPSCO and NiSource set a target for a 90 percent reduction of greenhouse gas emissions by 2030 (from 2005 levels), to reduce climate risk and realize an opportunity for lower-cost clean energy resources and customer savings. NIPSCO announced in 2018 that they will shutdown and demolish the coal-fired power plant in Michigan City by 2028.
As companies like NIPSCO transition away from outdated energy sources, we should keep in mind that industry jobs should not be sacrificed in the process. Instead, industry jobs should be included in the transition to eventually become green jobs! Other industrial giants should follow the example set by NIPSCO and transition towards sustainable practices for their businesses, customers, and employees!
NWI Industry and Legacy Pollutants
Climate resiliency isn’t only about reducing greenhouse gasses, it is also about reducing stress on the environment which allows natural systems to be more resilient to climate change and allows humans to benefit from ecosystem services provided by healthy, biodiverse, natural systems. Northwest Indiana is an incredible biodiverse region with abundant natural resources that are important to our communities. But it is also an area of major industrial development.
Northwest Indiana is known as a rust belt due to its rich history of industry. One of the biggest industries in Northwest Indiana is the production of steel. Because of facilities such as U.S Steel Gary works pictured to the right, Northwest Indiana struggles with ongoing emissions of pollutants along with legacy pollutants from decades of industry.
Legacy pollutants such as PCB’s, chromium, and lead stay in the environment long after the source is gone. These pollutants are a direct threat to local ecosystems and negatively impact human health.
In April of 2017, U.S. Steel illegally spilled around 350 pounds of highly toxic chromium into the waterway that feeds directly into Lake Michigan. As a result, public beaches from Gary to Michigan City were shut down, public drinking water intakes were closed, and aquatic life was impacted.
Industrial success and economic prosperity should not be valued so highly that it excuses the act of endangering our regional communities and ecosystems. To be a resilient region, we must continue to demand improvements in industry technology that reduce emissions of climate altering greenhouse gases and pollutants that degrade human and environmental health.
Food Production
According to the Indiana State Department of Agriculture, in 2017 more than 80% of land in Indiana is cultivated for farming. Indiana is also the 8th largest agricultural exporter in the country.
According to the EPA, agriculture contributes about 11% of the total greenhouse gas emissions nationwide. Heavy machinery for industrial farming releases carbon dioxide, causing land degradation over time. Land degradation is commonly found in cultivated areas, however, which can be attributed to the types of farming practices used.
Traditional farming practices such as tilling and monocropping remove nutrients in soils, and damage vital bacteria and fungi. This leads to farmers using large amounts of synthetic fertilizers and pesticides, contributing to ongoing soil depletion and pollution to our waterways. Soil infertility is a serious threat to our food supply.
Indiana Climate Change Impacts Assessment
If you are particularly interested in the intersection of agriculture and climate change, you may want to refer to the Purdue Indiana Climate Change Impact Assessment on agriculture - https://ag.purdue.edu/indianaclimate/
Livestock & Climate Change
According to the Hoosier Environmental Council, “more than 85% of all livestock produced in Indiana come from factory farms.”
Concentrated animal feeding operations, otherwise known as CAFOs, are industrial-scale animal factories. A CAFO is considered a warehouse that has at least 1,000 cattle, 2,500 swine, or 100,000 fowl in a confined space.
Indiana is home to over 2,000 CAFOs!
Because animals are living inconfined conditions, industrial farms tend to overuse antibiotics, the same ones used to treat humans for illnesses.
The overuse of these antibiotics creates pathogens the antibiotics can't kill, developing resistance to ALL antibiotics. This resistance spreads to waterways, soil, and humans, creating an alarming public health threat.
Indiana factory farms are contributing to climate change, not only from an enormous amount of unregulated livestock manure producing methane, but also causing air, water, and land pollution. Industrial animal agriculture is the number one source of methane worldwide.
If you want to know more about CAFOs in Indiana and their impacts on the environment, you can follow and support the Hoosier Environmental Council or HEC.
Consumption and Waste
Food and waste production creates a significant greenhouse gas impact. Food in landfills generates methane, which is 30x more potent than carbon dioxide. Waste generated by livestock is a major source of methane. You can start to see how a plant-based diet would eliminate several sources of methane from production through consumption. And while methane capture technologies are advancing, we must aim to eliminate methane wherever possible.
Now think about all the food and drinks you’ve ever bought that came in plastic containers. Plastic pollution leaves a permanent footprint. All plastic that has ever been produced is still on earth today. It also breaks down into millions of tiny pieces called “microplastics”.
Single-use plastics, produced by giant corporations using fossil fueled operations, are set to grow by 30% in the next 5 years, despite its contribution to the climate crisis. For example, in 2019 alone, Exxonmobil was responsible for 5.9 million metric tons of plastic waste.
In 2019, the Center for International Environmental Law (CIEL) estimated that production and incineration of plastic would add 850 million metric tons of greenhouse gasses to the atmosphere – equivalent to 189 coal-fired power plants. By 2050 this could rise to 2.8 gigatons of carbon dioxide per year or 615 coal plants' worth.
Any waste that degrades the planet limits our resiliency and makes us more vulnerable to climate change.
Section 2: Impacts of Climate Change
What are the additional challenges presented from ongoing climate change? The data is here to show us what to expect. How does that impact us?
Global/Local
For a long time we heard about climate change in remote regions of the world like the Arctic, Greenland, and Antarctica. We have been warned about the wildfires and deforestation rampant in the Amazon. But, climate change impacts are coming home to roost.
In just the past decade we have watched the Colorado river drying up due to a megadrought, we have heard about sea level rise impacting major US cities like Miami, flooding in Louisiana, and in the future we expect natural disasters to be more frequent and intense.
Locally, climate change is already impacting us with worsening air quality and severe weather events, such as extreme heat days and frequent flooding.
Rising Temperatures
How much warming is too much? The Paris Climate Agreement sets out a global framework to avoid irreversible climate change effects by limiting global warming to well below 2 degrees celsius and pursuing efforts to limit it to 1.5 degrees celsius above pre-industrial levels. This agreement directly targets global warming and aims to strengthen countries’ abilities to deal with the impacts of climate change and support each other in efforts.
Shown in the graph from Copernicus Climate Change Service, in December of 2020, global temperatures had already reached approximately 1.18 degrees celsius. If this warming trend continues, we will reach 1.5 degrees celsius by January of 2034. While it IS too late to avoid impacts from climate change, we need to act now to adapt to the changes we are experiencing. But it is NOT too late to take actions to become more resilient to the impacts of climate change. This data highlights the urgency with which we need to act to reduce or eliminate human contributions to ongoing climate change.
Schools Closing for Heat Days
Closing for snow days? Think again! More days with extreme heat is putting education at risk, resulting in schools closing for heat days. Heat is the number 1 weather related killer, with children and the elderly most vulnerable for heat related health complications.
Pictured on the right is Michelle Braxton, holding her 4 year old daughter at an early dismissal due to heat and inadequate cooling in the building at Franklin Square Elementary School in Baltimore, Maryland.
Excessive heat claimed an average of 138 lives per year in the U.S. from 1990-2019, according to the National Weather Service.
That number will only continue to rise, especially in vulnerable communities who don’t have access to reliable air conditioning.
2011 to 2020 was the warmest decade on record. We continue to see multiple heat records surpassed across the country and community cooling centers are now an essential part of community planning and public health.
Climate change has caused increased precipitation & intense storms in Indiana
Climate change has not only caused an increase in extreme heat days, but also increased precipitation and intense storms in the Midwest, including Indiana. These graphs, retrieved from the Purdue Climate Change Assessment, show the annual total precipitation levels in Indiana from 1895 to 2015, along with more frequent extreme precipitation events in Indiana from 1990 to 2010. The linear trend lines show rising trends in both overall precipitation on the left with a more dramatic increase shown in recent decades. The graph on the right shows an increase in the occurrence of extreme precipitation events.
Flooding
Long time residents of Northwest Indiana surely remember the 2008 flood that devastated homes and businesses across the region. Floods near Munster, Hammond, Griffith, and other northwest Indiana towns were declared a federal disaster and emergency services from the Federal Emergency Management Agency (FEMA) were required.
The likelihood of extreme weather events, flash floods and river floods are increasing. With the progression of climate change, we should prepare to see floods similar to the 2008 floods in the near future. The 2008 flooding foreshadowed what we might experience under future climate change scenarios and provided unique insight into the importance of taking action to become more resilient to extreme weather events.
Tamarack Hall
Tamarack Hall on IUN’s campus was also among the extensive damage seen in the region during the 2008 floods. We can see on the left where Tamarack was located on the north side of campus.
Due to the extent of the flood damage, the building was unfortunately demolished shortly after the flood.
Today we can find a Tamarack Hall Historical Marker in the greenspace that was once where the building stood.
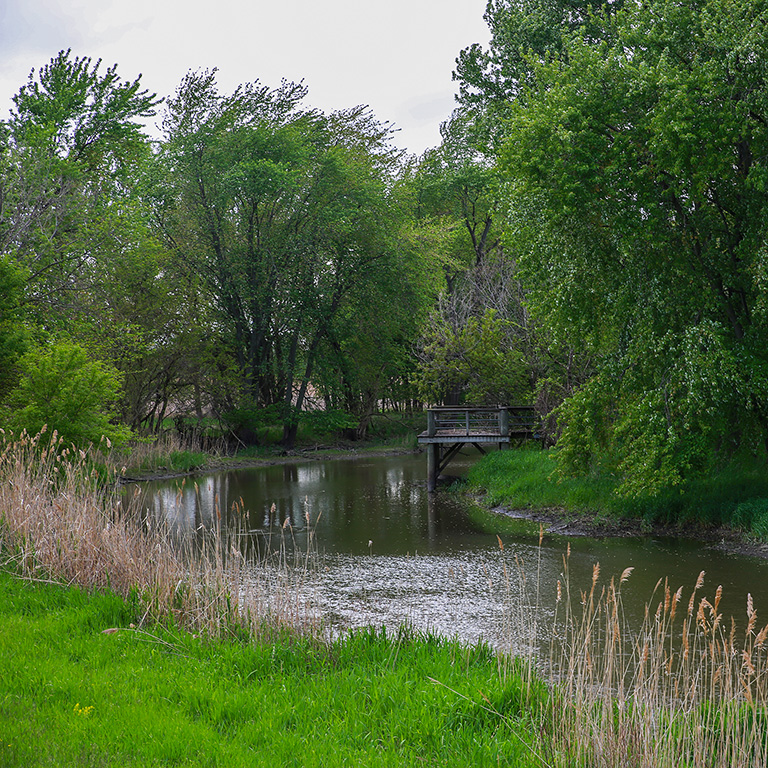
Portions of the IUN campus lie within the Little Calumet River Floodplain and increased flooding events in the area are a predicted consequence of future climate change.
Land Development & Habitat Loss
While we just finished highlighting the hazards of flooding, sometimes “wet” “land” isn't always a bad thing! Wetlands are essential ecosystems that actually help reduce flooding, control erosion and sediment loss, and filter pollutants. There are many types of wetlands such as marshes, swamps, fens, bogs, and oxbow lakes. All of these provide benefits to nature and people. A wetland is an area of land where water covers the soil, or is present near the surface, for all or part of the year. The trick with this definition is that many areas that function as wetlands are not visibly wet and can be destroyed or damaged. They can also be cheaper land that is targeted by developers that fill them in and destroy their ecosystem services forever.
Unfortunately more than 85% of Indiana wetlands have been lost since 1800. You won’t always “see” water in a wetland and they can become targets for development. Human activities such as commercial and residential land development, and even agriculture, alter natural landscape functions, land permeability, water storage, and degrade habitats.
Another land use fact that might surprise you is that 87% of Indiana land was forested prior to the 1800’s. That number dropped to just 7% by 1917; however, restoration efforts increased forested land cover to 21% by 2010. Unfortunately restoration efforts for wetlands in Indiana have not seen the same results, which will impact our economy, our ecosystems, and diminish our capacity to be resilient to the challenges of climate change.
Impacts on Agriculture
While we have been talking about how agriculture impacts climate and alters landscapes, it’s essential to note how all these changes also circle back to impact agriculture. Without the protection of wetlands and flood mitigation measures, increased flooding will damage agricultural fields, resulting in soil erosion, diminishing crop yields, and eventual economic strain. Extreme heat events are just as bad for farm fields as floods, but present a very different challenge: droughts.
Extreme heat will also reduce crop yields and disrupt food availability. If droughts occur, farm fields will have to be watered through irrigation systems, which will result in excessive use of local drinking water supplies and an overall increase in food production costs.
Section 3: How Do We Measure Progress Toward Carbon Neutrality
How do we understand the impacts of climate change and become more resilient in our homes, communities, institutions and industries? There are many sustainable solutions out there, but they present themselves in different ways, such as through community projects or even home improvements.
Understand the Impacts: Hoosier Resilience Index
The most important thing you can do is to start by educating yourself about the local impacts of climate change. The Hoosier Resilience Index is an Indiana-focused tool used to measure extreme heat, high precipitation levels, and floodplain land use data.
The online map visually shows that Lake County, and the rest of the state of Indiana is expected to experience 3 times the amount of extreme weather events, specifically intense heat waves and heavy rain events if we do not limit emissions.
The Hoosier Resilience Index is a public online resource, in partnership with the Environmental Resilience Institute for anyone in the state of Indiana to use to measure what extreme weather events may look like in their counties and communities in years to come. By clicking on your county, you can get detailed information about predicted changes in temperature and precipitation, along with flood maps for your area. You can visit the HRI website for more information
Environmental Resilience Institute
Indiana University’s Environmental Resilience Institute (ERI) brings together a broad, bipartisan coalition of government, business, nonprofit and community leaders to help Indiana better prepare for the challenges that environmental changes bring to our economy, health, and livelihood.
In 2019, ERI, in partnership with Sustain IU and the Northwest Indiana Planning Commission (NIRPC), launched a Resilience Cohort Program to help Indiana cities, towns, and counties measure and reduce local greenhouse gas emissions.
In 2021, the Resilience Cohort assisted a group of communities on the path toward greenhouse gas reduction. These first-year greenhouse gas inventory participants included the following Northwest Indiana communities: Cedar Lake, Chesterton, East Chicago, Highland, Hobart, Merrillville, Schererville, Munster, Valparaiso, Lake Station, LaPorte, Lake County, LaPorte County, and Porter County. Michigan City and Gary also conducted their own greenhouse gas inventories in the previous year of 2020 through ERI.
The inventories completed in the program account for 46% of the state’s population.
The Process: Climate Action Planning
A greenhouse gas inventory is the main tool using for climate action planning
The first step is to inventory emissions,
step 2: establish targets
step 3: develop climate action plan
step 4: implement climate action plan
step 5: monitor and evaluate progress
ERI Implementation Manager Andrea Webster said it best,
“After a couple years of helping our cohort members gather data and create emissions reduction plans, we are excited to assist these local governments with tangible actions that reduce greenhouse gasses,”
“Fully implementing climate action plans will take years of effort and sustained commitment, but some of the benefits, such as green jobs, lower utility bills, and improved air quality, can be realized much sooner. By prioritizing emissions reduction today, our Hoosier towns, cities, and counties are taking critical steps to combat climate change and create more livable, equitable, and resilient communities.”
Understand GHG Emissions Using Inventories
Greenhouse gas inventories provide us with knowledge of where emissions are coming from, assigning quantities, and providing the groundwork for creating an action plan.
GHG emissions are measured in Metric Tons of Carbon Dioxide Equivalents (MTCDE) which is a standardized unit of measure utilized for totaling the emissions associated with various greenhouse gasses into one value.
This process recognizes that different gasses have different climate forcing impact and global warming potential values. A formula is used to account for both potency and duration of the gasses in the atmosphere. Though the GHG inventory process is rigorous and based on science, estimations are inherent to the process.
The graph shown was provided by IUN’s inventory.
Greenhouse gas emissions are divided into 3 scopes.
Scope 1 emissions are those directly associated with campus – including emissions associated with entities owned by IU, like boilers, furnaces, vehicles, fertilizer, and refrigerants.
Scope 2 emissions are those indirectly associated with campus due to purchased electricity.
Scope 3 includes other emissions indirectly associated with campus activities, like those associated with commuting, business travel, food and paper purchased by the campus, waste and wastewater produced by the campus, and transmission and distribution (T&D) losses.
NWI 2017 GHG Emission Baseline
The graph shown is the breakdown of the 2021 regional greenhouse gas inventory provided by NIRPC.
Here we can see the energy and industry processes accounted for the majority of carbon emissions in 2017.
Having an inventory that clearly identifies and quantifies GHG sources is the essential tool for establishing targets and identifying specific actions that can be taken to reduce emissions.
IU Northwest: GHG Emissions by Source
This slide shows the actual metric tons of carbon dioxide equivalents for our campus. Examples of IU inputs by scope are noted in blue, green and gray on the screen.
The inventory only accounts for emissions associated with campus operations, and doesn’t yet address the contributions from individuals. But it provides a foundation for climate action planning.
This inventory helps identify sources from campus operations and prioritize actions that target sources with the highest emission values - like campus electricity use. Moving forward, annual inventories will allow IUN to track trends and assess the impacts of actions taken to reduce emissions over time.
A greenhouse gas inventory is a tool you can also use at home to track your emissions. Whether you are a community, a university, an industry, or a household - the overall goal is the same - to work toward carbon neutrality.
Carbon Neutrality (Slide 30)
So what is carbon neutrality?
Carbon neutrality is the state of balance between emitting carbon and absorbing carbon from the atmosphere. This can also be known as “net zero” emissions, and the goal is that no greenhouse gasses are released into the atmosphere.
Anything can be carbon neutral -- an individual, a household, a company, a specific product that a company makes, a city, a state, a country, even the entire world.
That may sound overwhelming, but it's also an opportunity to strive for carbon neutrality at many different scales and in many different parts of our lives.
This picture shows a yard sign for a house that has committed to going carbon neutral. It's part of an initiative from a non profit organization called “carbon neutral Indiana”. This house is neutral because it is balancing its carbon footprint using a combination of reductions and offsets.
Offsetting is Not a Substitute for Reducing (Slide 31)
Carbon reduction includes actions that directly lower carbon emissions - also called mitigation. Some examples of actions that reduce carbon emissions are using renewable energy, eating less meat, making a home more efficient, choosing public transportation, driving fuel-efficient vehicles, and avoiding fast fashion that can turn into landfill waste.
In contrast, carbon offsetting is where we can balance emission sources by creating carbon sinks. A carbon sink is something that takes carbon out of the atmosphere, like planting trees or even using industrial carbon capture systems.
Carbon Sinks (Slide 32)
One example of how IUN can reduce its carbon footprint by increasing carbon sinks is how the campus continues to improve its tree canopy.
More vegetation present directly results in more carbon dioxide absorbed through photosynthesis.
Over 100 trees have been planted since 2019 and the campus is Tree Campus USA certified.
The trees also provide shade, control temperatures, reduce stormwater runoff, combat air pollution, and add green spaces or green infrastructure.
Section 4: Building a Climate Resilient Region (Slide 33)
How can we make our cities more resilient? What does it take to achieve the support needed to take the first steps?
Change Gray to Green (Slide 34)
Climate models including the HRI indicate that Indiana can expect to experience more “intense rainfall” events meaning that more rain falls in a shorter period of time.
Managing intense rainfall events, stormwater runoff, and flooding will be a major challenge we face under a changing climate in Indiana. Stormwater runoff is water that flows over the land before it enters a nearby waterbody instead of infiltrating the ground. Intense rainfall events plus more land development means more water and more water pollution.
We need to stop runoff before it gets to the storm sewers by capturing water in place, creating more permeable surfaces, and managing precipitation where it lands!
To reduce stormwater runoff pollution, we should focus on changing gray to green! This means that we need to incorporate better management practices with green infrastructure in gray spaces to reduce and absorb stormwater runoff.
A simple approach like designing parking lots that replace elevated islands with curb cuts that allow water to run directly into low-lying areas can make all the difference.
Adding vegetation as bioswales, planter boxes, rain gardens, permeable pavements and trees helps to curb the heat island effect, conserve water, and reduce stormwater runoff pollution. Vegetation can be planted anywhere to achieve this effect, such as in rain gardens at home!
Community & Residential Stormwater Management Opportunities (Slide 35)
These pictures show examples of community and residential stormwater management opportunities. You may even have some of these in your community.
Either implement these green infrastructure tools in your own home, or advocate for these practices in your towns and at IUN by contacting local officials and planning commissions!
If you are interested in learning more about water resources and the impacts of climate change, please visit the Office of Sustainability’s module on water resources.
Looking at these examples, you can see a lot of beautiful plants being used to absorb stormwater runoff and mitigate other climate change impacts! But what kind of plants would fit best in green infrastructure in your community?
Rain Gardens & Native Plants (Slide 36)
No matter what, the plants native to your area are the best choice for your garden! Native plants are adapted to the local climate and soil conditions. These important plant species provide nectar, pollen, and seeds that serve as food for native butterflies, insects, birds and other animals.
There are a lot of benefits to planting native species. Native plants do not require fertilizers and require fewer pesticides than lawns. Native plants also require less water than lawns and help prevent erosion. The deep root systems of many native Midwestern plants increase the soil's capacity to store water, significantly reducing water runoff and, consequently, flooding.
Native plants help reduce air pollution by sequestering, or removing, carbon from the air.
Recommended Plants for Gardens in NWI (Slide 37)
Plants that are native to our region, as shown here, are recommended when you do any gardening in Northwest Indiana, whether you are creating a flower garden, a veggie garden, or a garden for capturing rainwater.
Columbine, purple coneflower, and black chokeberry are shown here. You can find these examples and many more in the Living In The Dunes Pollinator Guide from the Save The Dunes organization.
Simply planting native flowers, grasses, and trees is one way to build a climate resilient region from home!
Regenerative Agriculture (Slide 38)
Because of the threats it can pose to land quality, agriculture must also transition to sustainable practices, starting with regenerative agriculture!
Regenerative agriculture involves sustainable farming practices that emphasize conserving the land and regenerating the nutrients in its soil. One example of these farming techniques is vertical farming, which is actually used in Northwest Indiana!
Vertical farming utilizes controlled areas, like the greenhouse shown on this slide, to grow crops in stacked rows in the environmental conditions required for crop yields. This farming technique uses less land and water to grow crops than traditional methods, and farmers can control the crop growth cycle for year-round food production!
Green Sense Farms in Portage Indiana has shown their dedication to climate resilience in their use of vertical farming. The company has adopted sustainable farming practices that emphasize conservation and regenerating our soils.
You can also support local farmers by purchasing produce from local farmers markets near you. Farmers markets are great for supporting smaller local operations that are more likely to put sustainable techniques, like vertical farming, into practice.
Utilizing sustainable farming practices will reduce the impacts of agriculture on our surroundings, which includes not only land degradation, but also stormwater runoff pollution.
Know the Plans in the Region (Slide 39)
On a wider scale, the 2040 Comprehensive Regional Plan is the first plan with a comprehensive vision for sustainable growth and revitalization of Lake, Porter and LaPorte Counties.
The Northwestern Indiana Regional Planning Commission, a regional council of local governments, outlines a forum that enables citizens of Northwest Indiana to address regional issues, adopted the plan in 2011 with the following goals:
- Supporting urban reinvestment,
- Ensuring environmental justice,
- Protecting natural resources and minimizing impacts to environmental features, and
- Integrating transportation and land use to improve mobility and job accessibility
The Indiana Dunes Climate Change Adaptation Plan, finalized in May 2018, lists anticipated changes to the dunes and includes strategies for adapting to those changes. The non profit Save the Dunes met with local partners including the Field Museum and obtained funding from regional and federal resources. They identified potential goals and strategies suited specifically to the Dunes. The plan focused on localized climate change projections with conclusions and recommendations identified by experts.
Mammoth Solar Project (Slide 40)
With 13,000 acres and 2 million solar panels, Northwest Indiana is housing the largest solar farm in the US.
In total, about 60 landowners between Starke and Pulaski counties will be part of this project. That said, only about 20% of those acres will have panels on them.
It is expected to generate 1.3 gigawatts of electricity, enough to power about 175,000 homes in IN & IL annually.
Get involved in your community (Slide 41)
Just knowing the plan isn’t enough, you have to get involved too! In Northwest Indiana, there are plenty of regional organizations that you can support, join or collaborate with to make a difference in your community!
These organizations include the Hoosier Environmental Council, Save The Dunes, the Shirley Heinze Land Trust, the Northwest Indiana Food Council, and the Northwestern Indiana Regional Planning Commission.
Section 5: What Can You Do To Become Climate Resilient (Slide 42)
Creating a world that does not go against our natural resources and ecosystems is the first start to becoming resilient. We cannot wait until it is too late to create the environments we wish to live in. What you can do to become climate resilient.
You Can Make A World of Difference (Slide 43)
There’s a lot you can do to reduce your impact on the environment around you without completely changing your daily life. The important thing to strive for with climate resilience is progress, not perfection, and any sustainable practices you take on should be doable for you.
Just by eating less meat, switching to reusable shopping bags and upgrading to LED lightbulbs can be the start to a world of difference.
Plant Based & Locally Sourced (Slide 44)
When you think about sustainable diets, does your mind immediately jump to never eating meat again?
If that has you hesitating to change your diet, you’ll be happy to know that eating just one plant-based meal a day for a year will save almost 200,000 gallons of water. We don’t have to only eat plants, but the more plants and the less meat we eat, the healthier our planet will be!
Changing your food choices, even for just one meal a day, can make a big difference. Following this trend, if everyone in the US reduced their meat and dairy consumption by just half, it would be equivalent to taking 26 million cars off the road!
But we shouldn’t just focus on what we’re eating, but also where it comes from. Buying locally-sourced food will lower the emissions produced during food transportation, which is yet another reason to support your local farmers market!
Composting (Slide 45)
You can easily reduce your waste by simply recycling organic food scraps. Composted material is broken down naturally by microorganisms. This reduces waste in landfills, and reduces methane emissions.
To start composting, find a bin that fits in an outdoor space at your home.
In another bin, store browns like twigs and wood chips, to create a 4-6 inch base in your compost bin for aeration.
A third smaller bin can be used to collect food scraps, known as greens. Layer the compost bin with browns and greens and mix weekly depending on temperature and moisture.
After 8 to 12 weeks, you may harvest your compost to use as fertilizer for houseplants or veggie gardens, which will overall reduce food waste!
Carbon Neutral Indiana (Slide 46)
Carbon Neutral Indiana is a nonprofit that helps households understand and reduce their carbon footprint. The organization offers assistance through monthly subscription for carbon footprint measurement, footprint clean-up methods, carbon offsetting options, and strategic carbon reduction overtime.
DIY GHG Inventories (Slide 47)
You can do a greenhouse gas inventory for your own house.
How much water do you use in a month?
How many miles do you drive a month?
What is your monthly kilowatt-hour usage?
IUN and Regional GHG inventories have been conducted. These wide scale assessments can be used as a tool and example of how to track your own greenhouse gas emissions.
Climate Action Plan (Slide 48)
Climate action plans are used to list your goals for reducing your climate change impacts! As we said previously, the goal is progress, not perfection. When creating a climate action plan for yourself, you want to choose goals that you know you can meet. For example, in the first year, you can change up your diet to include organic foods and more plant-based meals.
Over the next three years, you can cut down your meat consumption slowly, maybe even working up to not eating meat for part of the week!
Lastly, by the fifth year of your climate action plan, you can advocate for the creation of a farmer’s market in your area if you don’t have one close by. Farmers markets provide great options for locally sourced, sustainable foods in your community! Or, invest in an electric vehicle.
Get Involved at IU (Slide 49)
Get involved on campus by staying up to date with information from the Environmental Resilience Institute, Sustain IU, and join a club on campus like the Sustainability club or Geology club!
For more information, please visit IUN Office of Sustainability Website (Slide 50)
********************************************